Supply Volatility Index
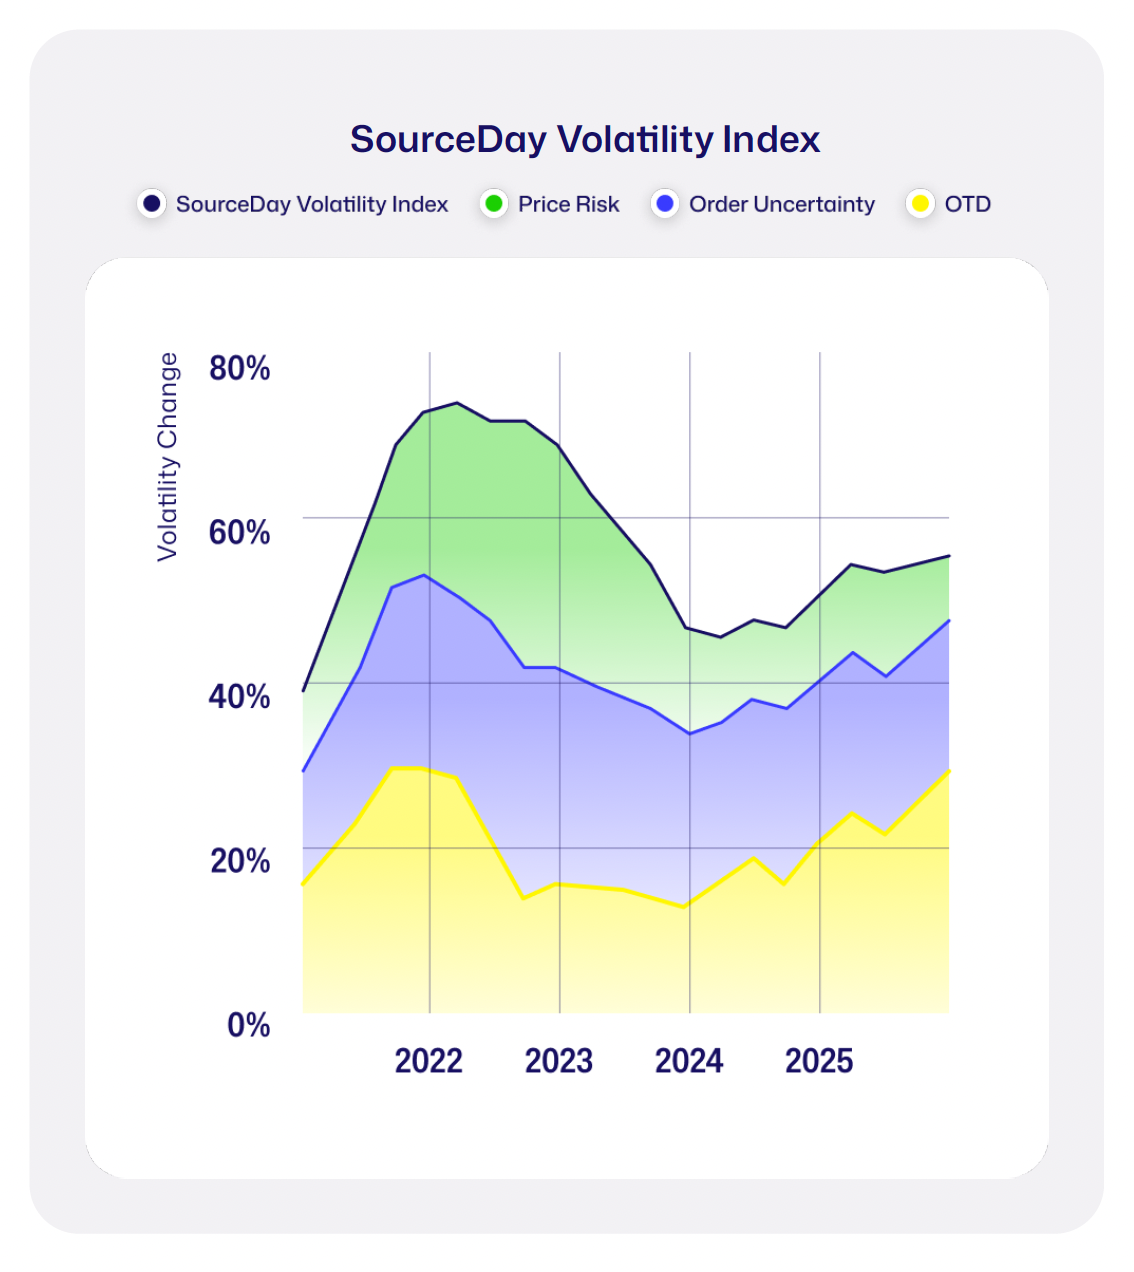
SourceDay’s Supply Volatility Index is an analysis of supply chain volatility from the pre-pandemic period through post-pandemic recovery (Q1 2021–Q3 2025). It identifies critical drivers impacting inbound supply stability for manufacturers and distributors that use SourceDay to automate the vendor purchase order lifecycle. Volatility factors include on-time delivery (OTD), price risk, purchase order uncertainty (PO changes), and overall supplier engagement.
This report is designed to help manufacturers and distributors spot early signs of instability and make more informed operational decisions.
Executive Summary
The Supply Volatility Index analyzes SourceDay’s proprietary data, generated from processing real-world, inbound supply chain spend. In Q3 2025, it analyzed $5B in direct spend across more than 100,000 global suppliers for North American manufacturers and distributors.
It measures volatility across inbound supply using key drivers like on-time delivery (OTD), shifting prices, and purchase order (PO) changes. By monitoring and reporting trends, this report helps manufacturers and distributors spot early signs of instability and risk, so they can make smarter business decisions.
In Q3 2025, overall supply volatility reached its highest levels since the last peak in 2022, during the Covid pandemic. Volatility trended up at a similar rate, but its sources and root causes have changed.